Debugging With Developer Tools
The Chrome developer tools (and to be fair, similar tool sets in other mainstream browsers) are a fantastic resource for locating bugs in your JavaScript, CSS and HTML. At the time of writing, the inbuilt debugger that comes with VS Code can be used to debug JavaScript running on the Chrome and Edge browsers but the most comprehensive approach is still to use the Chrome Developer tools. This may change in the future, so do please visit the book website for updates and changes.
Opening the developer tools
With the problem web page (game, in our case) open in Chrome then on Windows or Linux machines hit the <F12> key (or <Ctrl><shift><j>). On Apple Mac you need the key combination <alt><cmd><j> and on Chromebook the <ctrl><shift><j> combination is needed. Alternately, you can use the browser menu “More Tools” and “Developer Tools” options on all types of PC.
Reloading the web page after a fix
This used to be a difficult area for developers prior to recent changes to VS Code and these notes are still included here for anyone running their browser from a double click on the HTML file or using an alternate code editor. Users of VS Code can use the reload button that forms part of the “run” toolbar when running an HTML page.
That reload button will always do a hard browser reload. Read the rest of this section to see why that is a good thing.
The design of web browser software expects the content HTML to change frequently and so that is always reloaded when you press the browser refresh button. The related CSS and JavaScript is not expected to change very often and so these resources are cached by the browser. This is designed to enhance the user’s experience by loading a page quickly using those cached resources. This is great when you are just browsing the web but not so great for developers who have just fixed a crucial bug in their JavaScript. Just reloading the page will usually mean that the bug is still apparent as the page will still be using the old version of your code.
First though, do check that you saved the bug fix changes you made. That catches everyone from time to time.
Now you need to ask the browser to reload the page with a fresh copy of the CSS and JavaScript. The method will differ depending upon your PC type.
On Windows and Linux PCs the key combination <Ctrl><F5> will do the trick
On Apple Mac machines then <cmd><shift><r> should do it. Some sources say that <ctrl><F5> should also work on a Mac but not on my machine. There are reports that some developers (OSX version unknown) have hit problems but not to worry if you run into difficulty and you have the developer tools open (see below).
Chromebooks are similar to the Apple Mac. The key combination <ctrl><shift><r> will force a hard reload.
For all platforms when you have the developer tools open you can right click on the normal Chrome refresh icon and select “Hard Reload”.
Positioning the debugger tools
You can dock the debugger window (which is made up of a lot of sub-windows at the right, left and bottom edges of the browser window. You can also opt to undock altogether and use the tools in a separate window. You can pick the option that suits you best given the content of the web page. In most instances I find docking on the right-hand edge is best. The web page is resized nicely to sit alongside the debugger window. The debugger menu displays the docking options at the top of the dropdown option list.
Debugging JavaScript
A common situation (particularly with a new program) is that Chrome loads the page but JavaScript does not seem to have run at all.
This can often be the result of JavaScript syntax errors. When you open the developer tools you might well see a red icon  at the top right of the debugger window with a number next to it.
This will indicate the number of errors that have been detected by the Chrome browser.
at the top right of the debugger window with a number next to it.
This will indicate the number of errors that have been detected by the Chrome browser.
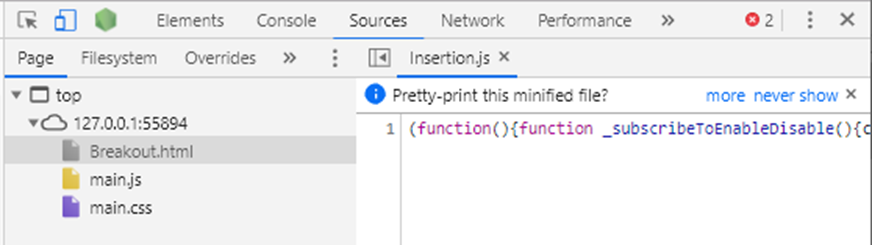
So we can review some example bugs, I have deliberately introduced errors into the Breakout game code so that you can see how these are identified. Please don’t get the impression that I don’t have bugs when coding. I do, all the time, and they get tracked down and fixed in just the way you see here.
Back to that partial screen shot showing that two errors were detected. Please note that the "Sources” tab is selected at the top of the window. Take a look at the section on the left where the three game files are listed. In this instance, I clicked on the main.js file and the code was loaded into the section on the right. Clicking on the red error icon at the top right should reveal the error in the developer tools console window.

Here you can see an error clearly highlighted with a red underline and with the mouse hovering over the error the debugger has displayed an error message; “math is not defined”. Bug caught, the Math library name starts with a capital M. The line should have read:
const pi2 = 2 * Math.PI;Another common error at the start of loading a page is for a named resource not to be found.
The next image shows the top and bottom of the debugger window in just such a circumstance.
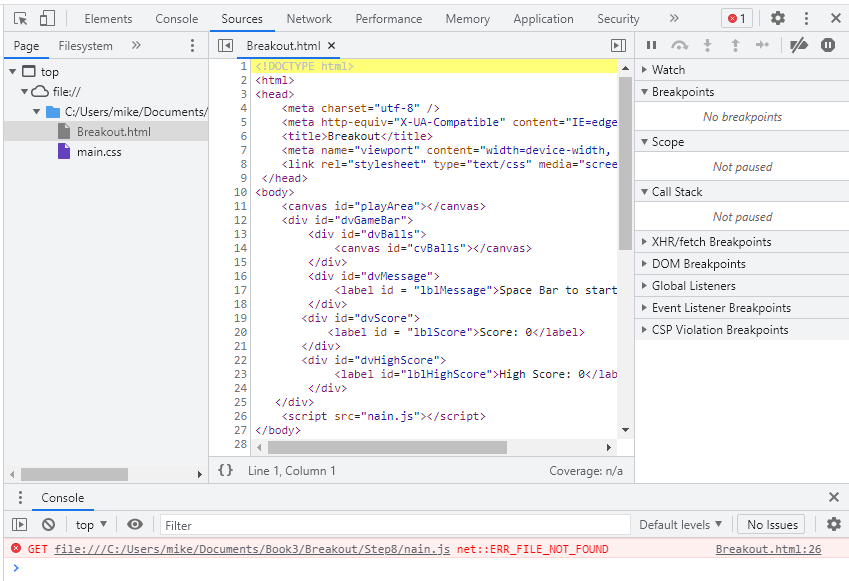
You can see in the left-hand panel that there is no JavaScript file listed. The error is identified at the bottom and shows that a file called “nain.js” was not found. This looks like an error in the HTML file. You can click on the HTML file name (Breakout.html in this instance) and scroll down and see that indeed the page had misspelled the name of the JavaScript file.
Readers working on Windows computers could have spelt the JavaScript file “Main.js” and it would have happily loaded as Windows file names are not case sensitive. If you did the same thing on a Linux PC, then this would result in an error when the page was loaded as “Main.js” would not be seen as the same file as “main.js”. Apple OSX is not case sensitive and, despite the fact that ChromeOS runs on top of a thin Linux layer, that file system is also not case sensitive.
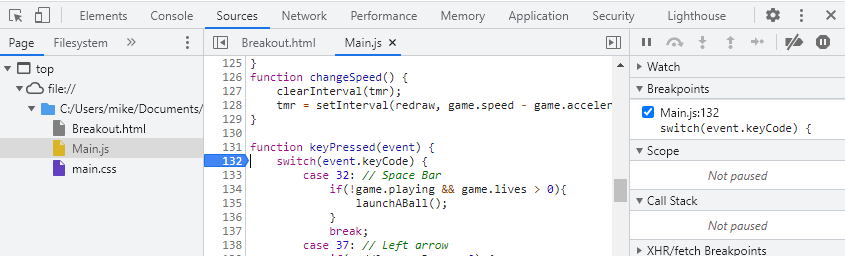
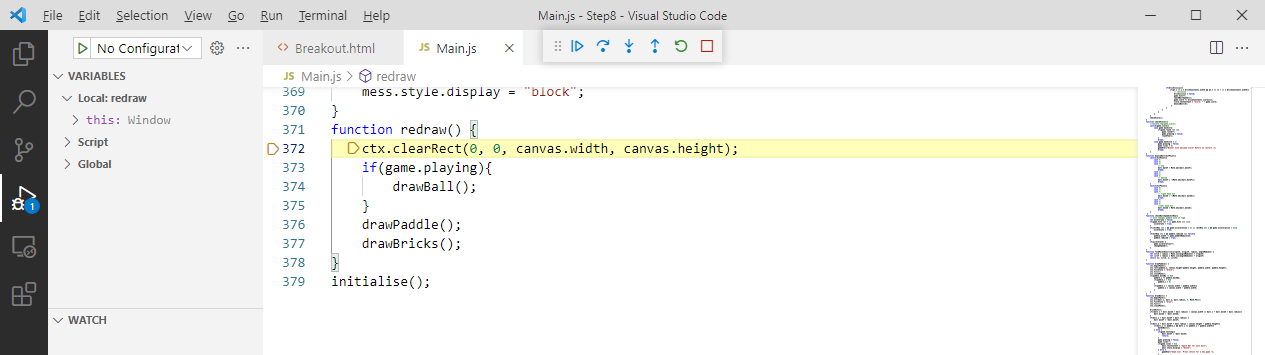
Now for a more subtle bug. Imagine loading the Breakout game and testing the keyboard arrow which should move the paddle. The left arrow is working fine but when the right arrow was pressed the paddle disappeared from the screen. How do we track down something like that?
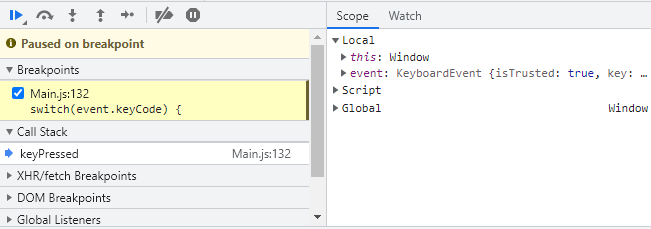
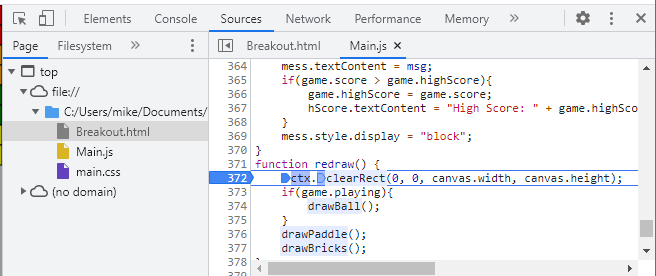
Thinking about how the bug came about, we might surmise that there is an error in the code that responds to keyboard input. With the developer tools window open we can click on the main.js source file and see it listed in the right-hand panel. If we scroll down to the keyPressed() function we can click on the source code line number next to (say) the switch statement at the top of the function. This sets a breakpoint in the code. You can see that marked in the screen shot and you will see it marked in blue in the developer tools window.
If you were now to click back into the web page to give it focus and press on that right arrow keyboard key the keyPressed() function will be called but the JavaScript code will halt when it gets to the breakpoint. If you hover the mouse over a variable in that function (say the event.keyCode) then the value will be displayed. Sometimes just being able to inspect the variables is enough to track down a bug. In this case though we might need to watch what happens as the function runs. The tools window gives us a toolbar of icons that, when clicked, controls how the code is executed in steps.
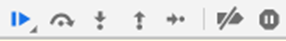
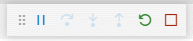
The toolbar icons in order are:
- Resume execution
- Step over the next function
- Step into the next function
- Step out of the current function
- Step
- Deactivate breakpoints
- Pause on exceptions
The toolbar is part of another section of the debugger window that gives us more information about the current JavaScript program execution. In this instance, it has identified the beak point and that there had just been a keyboard event. This section might be positioned to the right or below the window with the JavaScript source code depending upon how much width you have allowed the developer tools within the Chrome window. You can drag the window edges and some of the individual areas with the developer tools to provide the best view for any given debugging task.
Right now, the plain “Step” option looks the thing. Clicking this (or pressing the <F9> key if you have one – sorry Chromebook) will allow the JavaScript execution to proceed one step at a time.
In this instance, the code was run one step at a time until it reached the break statement after executing the code for case 39 (the right arrow key). The mouse cursor was then moved over the paddle,MoveX value and the display showed it was “undefined”.
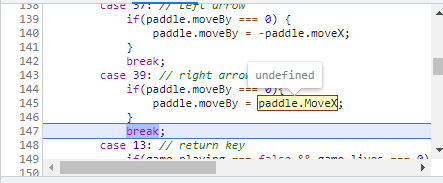
This was great news as the variable should have been paddle.moveX with a lower case “m” just as in the code for case 37 (left arrow). Easy to fix but one might wonder why it was not picked up as a syntax error when the code file was loaded. An undefined moveBy value would have meant that the paddle.x value also ended up undefined (in drawPaddle()) so it could not be drawn on the canvas object.
Misspelling Math was a clear JavaScript syntax error and the browser caught that. Misspelling an object component name is a little different. One of the “bad” features of JavaScript (that actually turns out to be useful) is the ability to add new members to an object instance just by making use of the newly named item in code. What happened here is that a MoveX value was added (by this code when it first executed) to the paddle object alongside moveX. Of course it was “undefined” as it had never had a value set. In this case that was a nasty bug but later in the book you will come across the upside of this feature. So that’s it – a feature and a bug but not a syntax error.
The ability to set one (or lots of) break points in your JavaScript code and to watch the execution of the code following on from any of those breakpoints is a very powerful debugging tool. You can check any variables values as the code is run. You can fix errors in the source and reload the page with the breakpoints still in place ready for you to continue debugging or just checking that the fix was the right one.
We rather skipped over the other code stepping options so here is a short explanation of those that might not be obvious.
Resume execution
If you click this tool icon, the icon switches to showing a pause option which can be handy if you want to stop the current program and see just what bit of code is currently being executed. Resume execution simply restarts the code execution after a breakpoint. The code will then continue to run until (maybe) it hits another break point or even the same one.
Step over the next function
If you do not want to follow the code through a given function then you can click this icon. The function will get executed and code execution will pause again once it has run. This can save repeatedly revisiting code that you have already checked out.
Step into next function
This deliberately follows the code steps into and through the next function.
Step out of current function
If you have followed the execution steps into a function then you can use this to jump to the point where that function execution is complete.
The Scope tab
When a breakpoint is reached and code execution is halted then you can use the scope tab to inspect local variables (those created in the current function) and global variables in this panel.

In the screenshot above, execution has halted in the launchABall() function. Notice the triangular “handle” icons next to each item in the scope list. You can use them to open up an object and inspect the individual values. Here I have clicked the one next to the ball object and I can see the current values of each ball member. They are mostly zero as the ball has not been launched. If there was a breakpoint on the last line of that function and the space bar was used to launch the first ball then the scope panel can be used to check the ball values and any other global variables and objects.
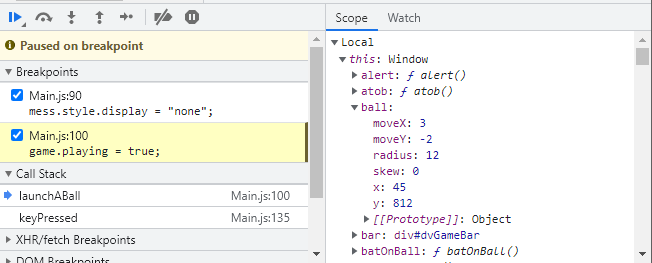
We can now see where the ball should be and where it is going.
Watch tab
The debugger can be used to watch specific values. If you click the “Watch” tab next to the “Scope” tab you can then click the plus sign to add a new variable to watch.
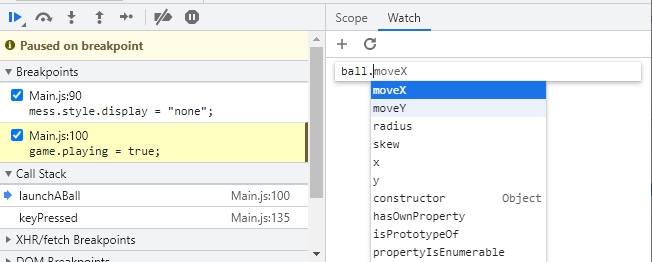
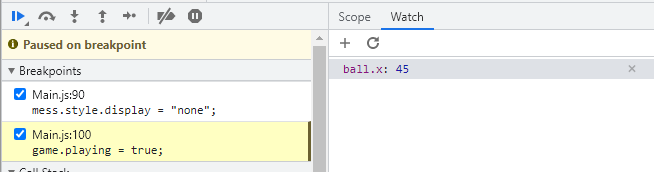
The screen shot above show me typing in a ball object variable. Notice the debugger intellisense feature in play here. If I select (say) the x member then the current value will be displayed. While this value is not continuously updated it will be updated every time a breakpoint is encountered. The screenshot below shows the updated display. You can, of course, set multiple variables to watch. If you want to remove an item from the watch panel then click on it and then on the X close icon at the right hand end of the line.
The console
I am not a regular user of the console when debugging JavaScript but there are circumstances where you may find it more intuitive than chasing values through the code between breakpoints.
To demonstrate how it works, I added a line at the top of the checkScore() function in the VS Code main.js tab so it started:
function checkScore(){
    console.log(game.score);
    switch(game.score){
        case game.maxScore:
        etc...
The function console.log() can display your messages or any variable values in the console panel of the developer tools window.
With that new line in place, I made sure I could see the console tab in the debugger window. Then I reloaded and started the game and waited for the brickHits() function to call the checkScore() function. The new console.log() function then caused the game.score to be displayed in the console panel.
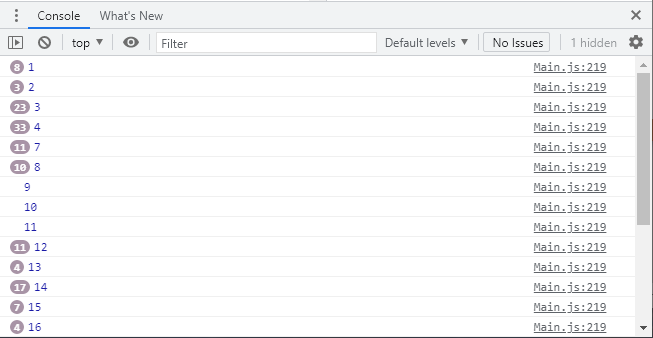
The roughly circled numbers next to the incrementing game scores represent the frequency that a given value was sent to the log. The brickHits() function gets called (indirectly) by the time event and redraw() and the score only changes when a brick collision occurs. So we get lots of duplicates.
This proved to be a good exercise as it was apparent that there was no need to make the call to checkScore() if the game.score was less than game.maxScore which should have been obvious once it was written. Indeed, it only needs to be called, even then, if the score changes. The game will run better if this is fixed so that was a win for the console feature.
The console can also be used to review and analyse errors trapped by the browser. Such errors might be in JavaScript, the CSS, images, fonts or the main HTML document. They are all recorded and can be tracked down and reported here.
JavaScript bug sill not fixed?
If you can’t figure out why a particular JavaScript line is producing an unexpected result then don’t forget that you can type just that line of code into the snippets tab window in Chrome developer tools. There you can play around with alternative expressions to see if you can achieve the desired result. Complex comparison expression in particular can be tricky to get right and often need brackets to isolate sub-expressions before the whole is evaluated. You can try these out very nicely in the Snippets area using the alert() function or output to the console.
The Visual Studio Code Debugger
This is probably a good moment to explore the integration of the VS Code JavaScript debugger with the Chrome browser. This is one area of the recommended developer tools that is likely to be strongly enhanced over the lifetime of this book.
This is an opportunity for you to join in by loading the finished Breakout game into VS Code, making the HTML file the current tab and clicking the Run Menu or just hitting the <F5> key if you have one. Then start the Chrome developer tools and click the Sources tab and the main.js file to load the JavaScript listing. Navigate that code listing to the redraw() function and then click the line number on the first line to set a break point.
Now look back at the JavaScript tab in VS Code. If you scroll down to the redraw() function there you will see that it has been marked as a breakpoint there as well.
If you experiment a little, you will find that you can inspect the current value of variables (just hover over a name in the code window) or step through the code using both the Chrome developer tools and VS Code.
Most people will probably find it simpler to use the Chrome developer tools as they can then more easily watch how the game is running as they step through the code. Anyone lucky enough to have multiple monitors could of course run VS Code on one and Chrome in another. This would simplify debugging from VS Code.
Debugging HTML and CSS
The Chrome developer tools can also be used to debug HTML and CSS issues. So far, the HTML and CSS we have used has been fairly simple but large complex pages (and games) need careful positioning of elements in relation to each other. We have already used JavaScript to hide and display a message label and the next game to be tackled in this book uses JavaScript to create and position a while host of HTML elements where precision will be important.
Common bugs that need to be investigated will be things like HTML elements that do not show up, HTML elements that are the wrong size or in the wrong place or (if they are supposed to overlap) elements stacked in the wrong order. HTML does not have to be static; bugs can appear and disappear as elements are created or deleted while a JavaScript program runs. Fortunately, we have the tools to deal with all of these issues and more.
We can have a look at how the developer tools work with the Breakout game before applying them to some other HTML documents.
If we are using the “Sources” tab and click on the HTML file then it is listed in the right-hand panel just like the JavaScript. However, there is another tab called “Elements”. That has a different view of the same HTML. Well, it is the same for the Breakout game but it could be very different. If JavaScript is used to change or add to the HTML elements then this second view will include those changes. The source does not change as that is the HTML as it was when loaded into the browser. The “Elements” view shows it as it is at a given moment in time. You will notice that the triangular handles sit by the HTML components that contain other components. You can click the handles to open each and inspect the contents.
If you click on an HTML element in this view then the panel below provides a lot of information about the styling applied to that element. The styling is derived from the CSS which can “cascade” down to elements contained within a styled object. With the Breakout game, we set some simple CSS rules for the HTML overall. Unless they are overridden these rules will also apply to the HTML elements within the dvGameBar <div>.
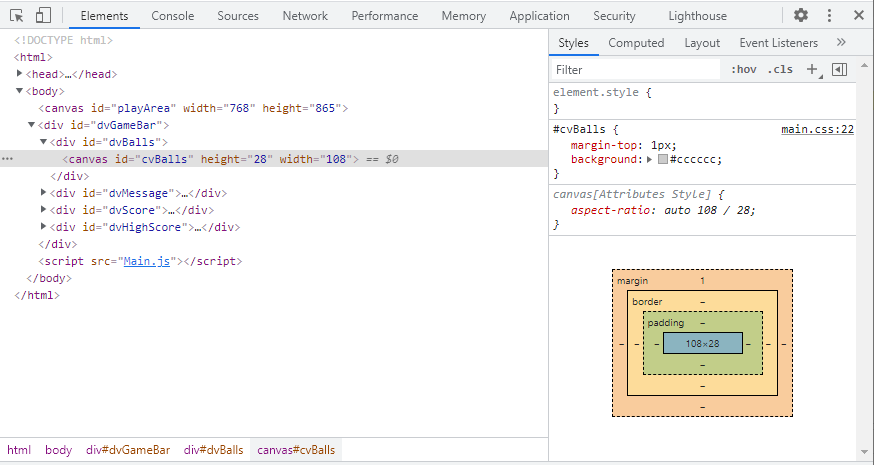
In the screenshot above, you can see the styling for the <canvas> element with the cvBalls id. The code from the CSS file that directly relates to this element is displayed. You can also see a block diagram of the element showing that its size (108 pixels wide by 28 pixels high). You can also see that it has no padding or border values set but that there is a top margin which was set by the element’s CSS.
If you click the Computed tab (next to the Styles tab above the block diagram then you will see a list of CSS settings that apply to the selected element. These will show any inherited or default CSS values that apply.
Invalid (or mistakenly omitted) CSS settings can be quickly identified and then fixed in the CSS file.
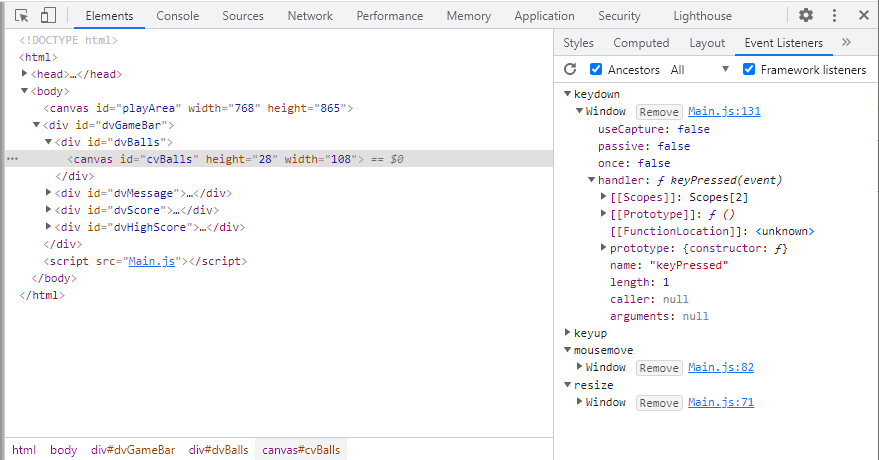
The next screenshot shows the “Event Listener” tab for a selected HTML element. You can see event listeners that have been attached to a game element or to the game window as a whole. If an element is not responding to a particular game circumstance this view would allow you to check that an event listener had been properly set.
Interaction with the Elements tab content will also result in sections of the web page (game) being highlighted in the main browser window. This is a very effective way of honing in on the HTML (and related CSS) that you want to investigate. In the next screenshot you can see that I have opened the developer tools while doing some game research on the Wikipedia web site.
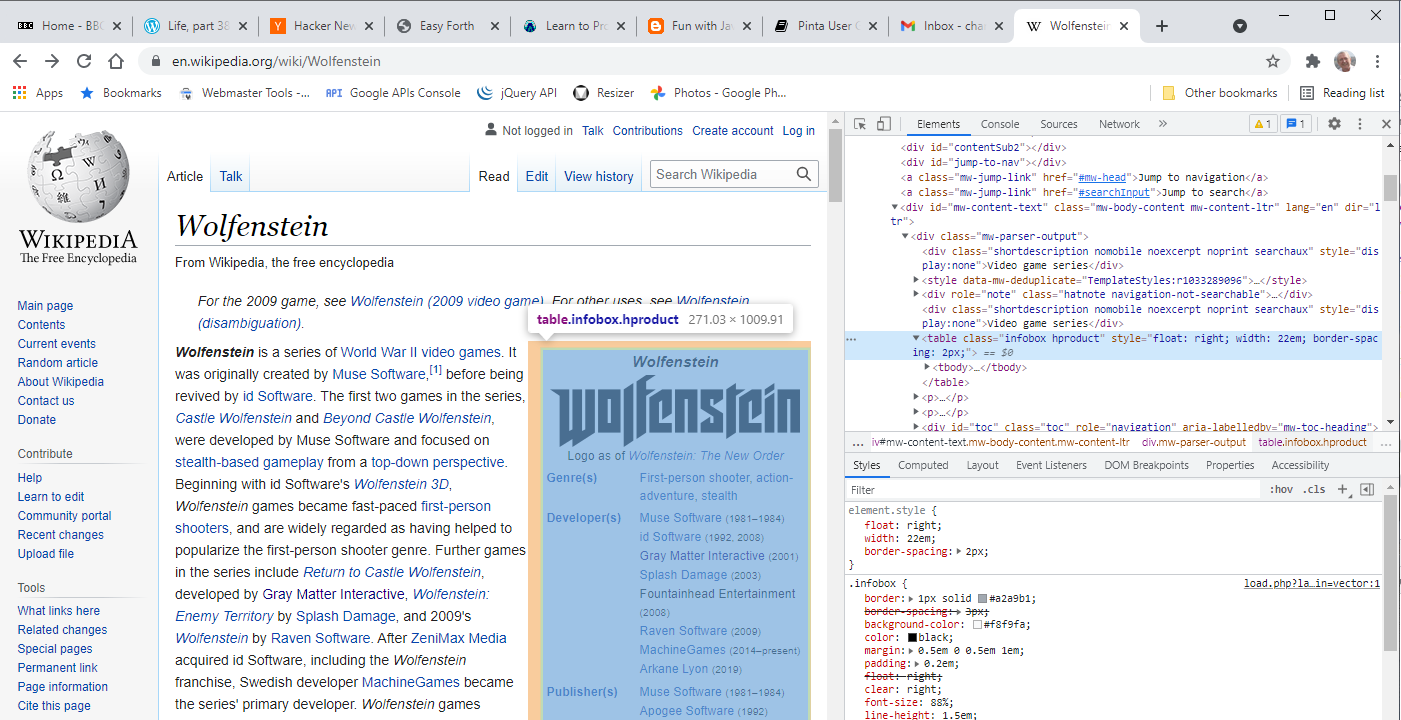
As you run your mouse cursor over a line of HTML in the Elements tab panel then the browser window highlights the same section as it is rendered in the window.
There is a mini toolbar to the left of the Elements tab.

If you hover your mouse cursor over these you will see that they have very different functions. The left-hand icon tooltip says “Select an element in the page to inspect it” so starting with that.
If you click that icon and then move the mouse cursor over the page then each element will be highlighted in turn and the relevant HTML will be highlighted in the “Elements” tab panel. This is a great way of quickly finding a key section of a complex HTML structure.
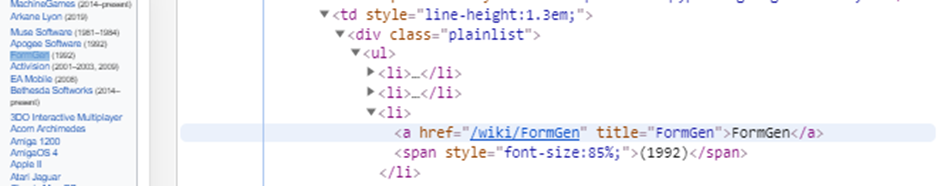
The partial screenshot below shows the tool being used to highlight a tiny section of the page on the left. The Elements tab panel shows that the HTML code was an <a> link tag inside an <li> list item inside a <ul> unordered list inside a <div> inside a <td> table cell (and the enclosing list goes on all the way up to <body>).
The other tool in that mini toolbar had a tooltip display of “Toggle device toolbar”. This handy tool lets you review how your game page would look on a range of mobile devices such as phones and tablets.
To try out this viewer I would recommend docking the developer tools window at the bottom of the browser window. The next screen shot shows how our Breakout game would look on an iPhone X in landscape mode.
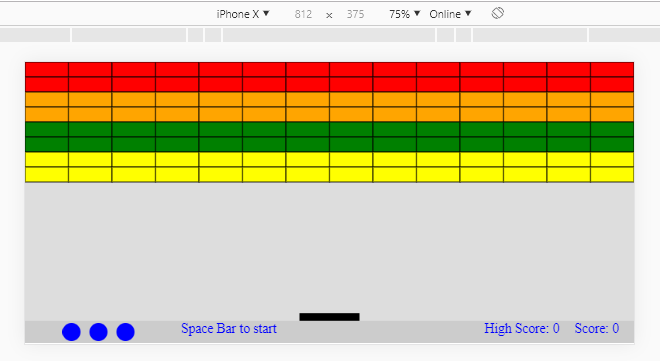
The device was selected from a representative list of device sizes and resolutions. We can see straight away that the game would need some modification to work well on a phone although we could easily test such modifications using this tool. Mind there are also the problems associated with not having an attached keyboard or mouse.
This book will deal with “touch” input in later chapters.
Internet Resources
Maybe you have isolated the problem to a line or section in your source but you can’t figure out what is wrong. This happens to everyone at one time or another. There are probably a large number of people out there who have hit the same issue and it is very likely that someone has posted online an answer that makes sense and suggested a fix or alternate approach.
If you can break the issue down into just a few words (that include, say, JavaScript if it is a JavaScript problem or HTML or CSS and type that into Google or duckduckgo there is a good chance one of the results on the first search results page will meet your needs. If the search results seem to be off at an angle to your issue you might need to change the words a bit (or the word order) to get the emphasis right.
Results from web sites such as StackOverflow can be very helpful although there is an assumption on that site that users are fairly technical. There is a good chance though that your question will have been asked on StackOverflow so it might also be worth searching that site itself if the first answers you see there do not quite answer your problem.
You can also just search for the main terms or just pose a “how to” question. Things like “JavaScript Math” or “How do I centre a div in another div with CSS?”. Such search terms will bring up either answers or wider posts on the general subject area that will often solve your problem.
Conclusion
Debugging code of any sort is a skill that develops with practice. The key underlying skill evolves when the code you are debugging is your own. Then your understanding of the structure (key functions and how they call each other) will ease the task of envisioning where a given error is likely to stem from. When you have located the most likely function to be causing a problem then, usually, the error becomes much more obvious.
Certainly, do not despair. We all generate bugs while writing code and we all run into bugs that prove difficult to track down. Often, they become much more obvious after a break spent thinking about something else. Sometimes laughably so. Going for a walk away from your PC can be a great debugging technique.
This chapter has not visited every feature of the Chrome developer tools. A spare few minutes now and again just exploring the tabs and options (maybe with an Internet search or two) will keep the key tools uppermost in your mind and will maybe find a new approach that will provide debugging dividends into the future.